jQuery plugin, Converts tables to charts & graphs using the HTML 5
Visualize is a jQuery plugin which converts tables to charts & graphs using the HTML 5 canvas tag.
The usage of tables is very important the data is already formatted in a way that is accessible to users browsing the web with a screen reader or other assistive technology.

The plugin offers a very easy usage as calling a function like: $('table').visualize(); is enough for creating a line, pie, bar or an area chart from a table.
Visualize offers various methods for customizing:
- the type (line, pie, bar or area)
- width & height
- title
- color
- margins
- & more
Here is a customizable demo to test the plugin completely.
 How to Start a Functioning Website Under Thirty Dollars 2021?
  A Simple jQuery Plugin For Flexible Floating Panels With Portamento.js
  A Light weight, small framework for beautiful forms: Ideal Forms
 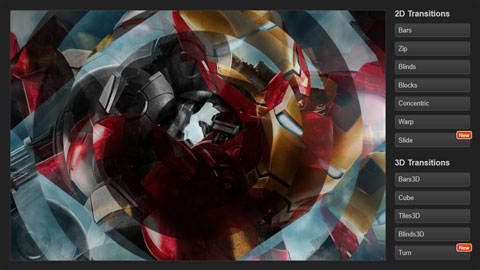 CSS3 Powered jQuery Image Slider for 2D or 3D transitions – Flux Slider
  Now Easy to Convert Websites Into Mobile Quickly: Mobilize.js
  The HTML5 Time Element Is Back and Better Than Ever
  Mozilla Introduce Firefox 9, with Speed and less memory improvements
 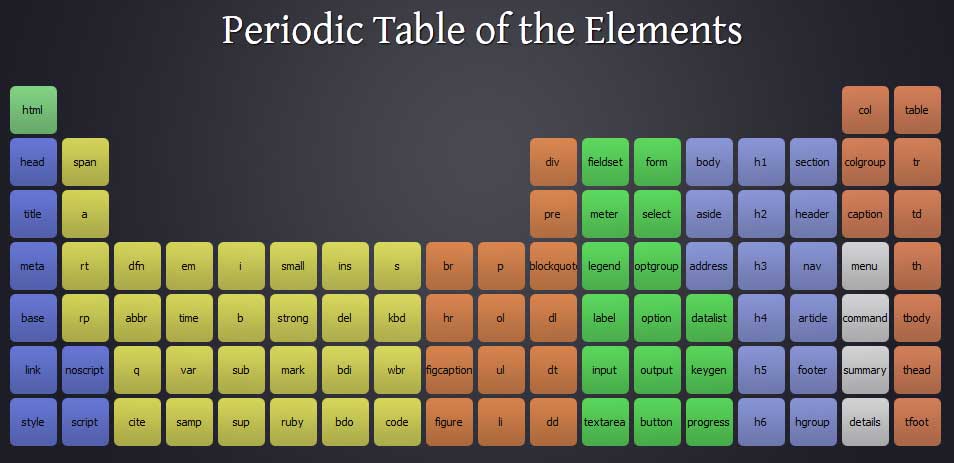 Periodeic table of HTML5 Elements, arrange by type.