Best Free JavaScript Charts Solutions
Canvas 3D Graph
Canvas 3D Graph is a special type of bar graph that plot numbers in 3D.
Flot
Flot is a pure Javascript plotting library for jQuery. It produces graphical plots of arbitrary datasets on-the-fly client-side.The focus is on simple usage (all settings are optional), attractive looks and interactive features like zooming and mouse tracking.
Flotr JavaScript Plotting Library
Flotr is a javascript plotting library based on the Prototype Javascript Framework (version 1.6.0.2 at the moment) and inspired by Flot (written by Ole Laursen). Flotr enables you to draw appealing graphs in most modern browsers with an easy to learn syntax. It comes with great features like legend support, negative value support, mouse tracking, selection support, zoom support, event hooks, CSS styling support and much more.
JS charts
JS Charts is a free JavaScript based chart generator that requires little or no coding. With JS Charts drawing charts is a simple and easy task, since you only have to use client-side scripting (i.e. performed by your web browser). No additional plugins or server modules are required.
HTML-Graphs
Use this script to create horizontal / vertical bar graphs, progress bars and faders. You can create simple graphs and even grouped bar graphs with legends, add labels, change colors etc. No graphics or graphical libraries required.
fgCharting Plugin for jQuery
fgCharting jQuery plugin is an accessible solution for charting data. It takes data in an HTML table and dynamically transforms the table into charts, allowing non-traditional browsers (i.e. – screen readers) access to the HTML table. Basic usage involves one line of code to initialize the plugin.
TableDiagram
The script generates a diagram (chart) view of the data in a table.The values in the table must be non-negative (more than or equal to 0). They can be either integer or decimal.
Pie Graph
This is a purely DHTML/ CSS based Pie Graph script. It loads fast and blends in with the rest of the page. You can also use a transparent image for background.
JavaScript Chart
One more lightweight script that allows to add a stylish chart to your Web page created by Magnus Lundahl.
JavaScript Diagram Builder
The JavaScript Diagram Builder v. 3.3 is a library of some objects and functions, which can help you to display a coordinate diagram (resp. a chart or graph) in your webpage in an easy way.


 Filter-Rich Java Script Image Effects Library – glfx.js
  How to Start a Functioning Website Under Thirty Dollars 2021?
  The HTML5 Time Element Is Back and Better Than Ever
  Mozilla Introduce Firefox 9, with Speed and less memory improvements
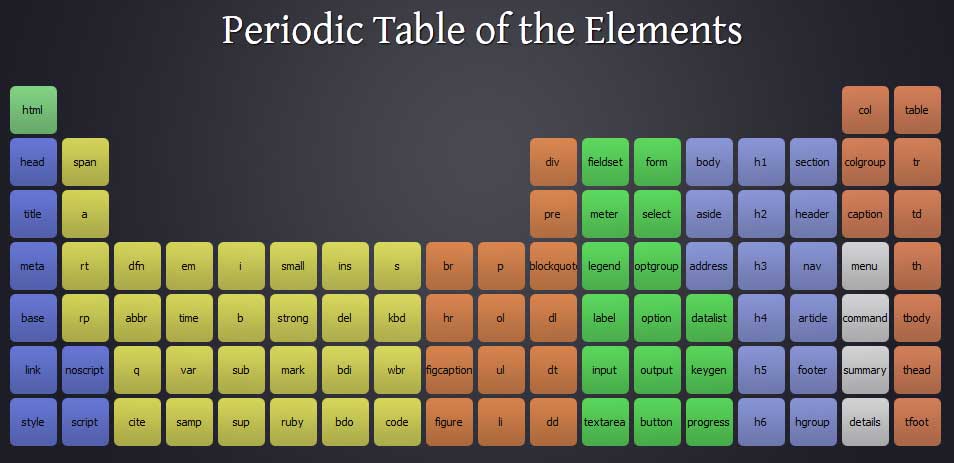
  Periodeic table of HTML5 Elements, arrange by type.