Best Flash Stock Chart's, Line & Area, Pie & Donut, Column & Bar, Scatter (XY) & Bubble chart
Best Flash Stock Chart’s, Line & Area, Pie & Donut, Column & Bar, Scatter (XY) & Bubble chart
Stock Chart’s main purpose is to display financial charts. However, it can also be used for visualizing any date-based data. Line, column, candlestick, OHLC, step line and area – all these types of charts can be displayed with this application. The features include a very comfortable scrollbar, data grouping into longer periods, displaying of data at irregular intervals, etc.

This Line & Area chart sets a new standard of usability for line & area charts. A visitor to your website will be able to zoom in on a particular period, turn values on and off, and show or hide graphs. With this tool, you can make:
- A simple line & area chart
- A stacked line & area chart
- A 100% stacked line & area chart

Universal and fully configurable Pie & Donut chart. You can use it to create:
- 2D or 3D pie charts
- 2D or 3D donut charts
- Beautiful navigation clusters

Scatter (XY) & Bubble chart can be used to display various scientific data, as well as presenting three-dimensional data in a 2D format. With this chart, you can make:
- Scatter charts
- Bubble charts
- Time plots

Column & Bar chart lets you build:
- 2D or 3D column charts
- 2D or 3D bar charts
- Stacked bar or column charts
- 100% stacked bar or column charts
- Floating bar or column charts
- Bar or column and line chart mix

 How to Start a Functioning Website Under Thirty Dollars 2021?
  The HTML5 Time Element Is Back and Better Than Ever
  Mozilla Introduce Firefox 9, with Speed and less memory improvements
 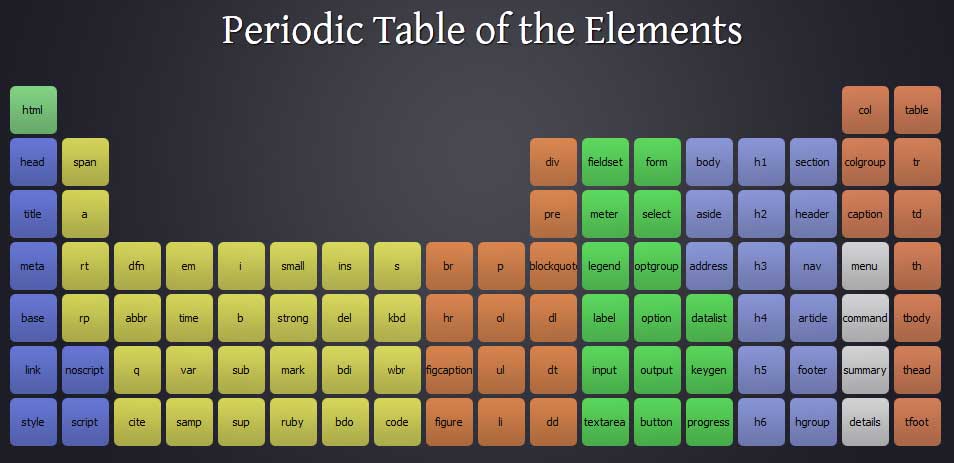 Periodeic table of HTML5 Elements, arrange by type.