JavaScript Data Visualization Toolkit: InfoVis
InfoVis is an open source JavaScript data visualization toolkit offering multiple ways to present data using the canvas tag.
It is feeded with data in JSON format & some of the ready to use visualizations are:
- treemaps
- radial layouts
- bar charths, pie charts & more?

Besides a static presentations, InfoVis supports interactive animations which can be fired by any event (like mouseovers, clicks).
It has various methods to add/remove/update nodes & manipulate every aspect of the outputs.
The toolkit doesn?t depend on a JavaScript framework, can be used with any of them & easily updated for adding new features to it.
Requirements: No Requirements
Compatibility: All Major Browsers
Website: http://thejit.org/
Demo: http://thejit.org/demos
 How to Start a Functioning Website Under Thirty Dollars 2021?
 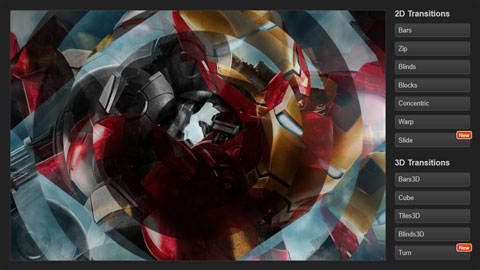 CSS3 Powered jQuery Image Slider for 2D or 3D transitions – Flux Slider
  Filter-Rich Java Script Image Effects Library – glfx.js
  Now Easy to Convert Websites Into Mobile Quickly: Mobilize.js
  The HTML5 Time Element Is Back and Better Than Ever
  Mozilla Introduce Firefox 9, with Speed and less memory improvements
 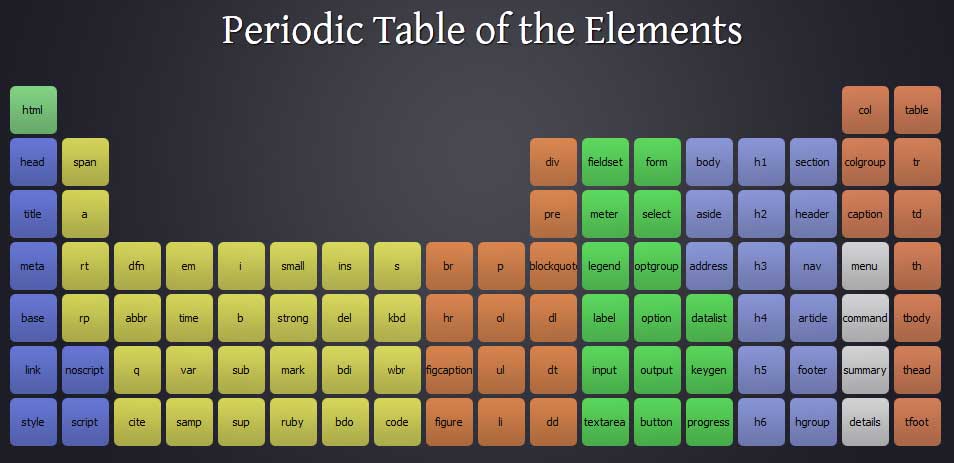 Periodeic table of HTML5 Elements, arrange by type.