Fun With Canvas: Create a jQuery Graph Plugin for your web.
In this two-part article, we will start from the beginning by implementing the logic of the plugin as a standalone script, refactoring it into a plugin and then finally adding all the additional eye candy on top of the plugin code. In this first part, we are going to deal solely with implementing the core logic.

Functionality
Our plugin needs to accomplish some basic things whilst not doing some other things. Let me elucidate:
- As usual, we are going to utilize only the canvas element and JavaScript. No images of any kind, no broken CSS techniques, no prerendering. Plain old (or is it new?) canvas element along with some jQuery to lighten our workload.
- With respect to the data source, we are going to pull all of the data directly from a standard table. No arrays to pass on the plugin at startup. This way the user can just put all the data in a table and then invoke our plugin. Plus, it is much more accessible.
- No special markup for the table acting as the data source and definitely no special classes names for the data cells. We are going to utilize only the ID of the table and pull all our data from there.
- No flimsy text overlay for rendering the labels and such on the graph. It is not only highly tedious but the rendered text isn’t part of the graph when it is saved. We are going to use the fillText and strokeText as defined by the WHATWG specs.
Find Full Article:
http://net.tutsplus.com/tutorials/javascript-ajax/fun-with-canvas-create-a-jquery-graph-plugin/
 How to Start a Functioning Website Under Thirty Dollars 2021?
 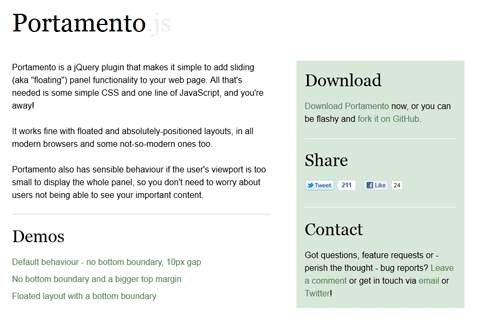 A Simple jQuery Plugin For Flexible Floating Panels With Portamento.js
 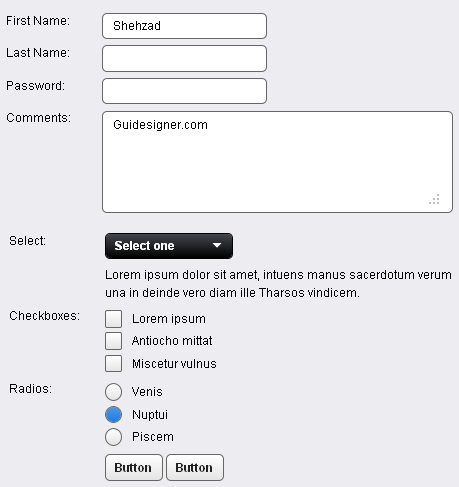 A Light weight, small framework for beautiful forms: Ideal Forms
 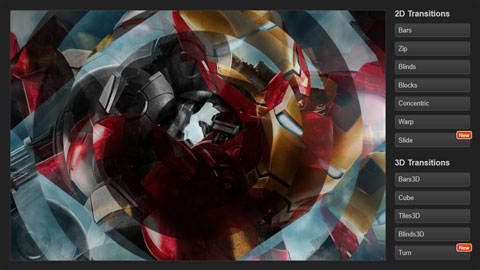 CSS3 Powered jQuery Image Slider for 2D or 3D transitions – Flux Slider
 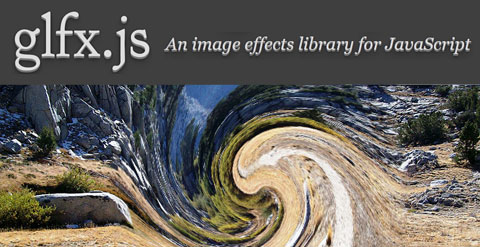 Filter-Rich Java Script Image Effects Library – glfx.js
  Now Easy to Convert Websites Into Mobile Quickly: Mobilize.js
  The HTML5 Time Element Is Back and Better Than Ever
  Mozilla Introduce Firefox 9, with Speed and less memory improvements
 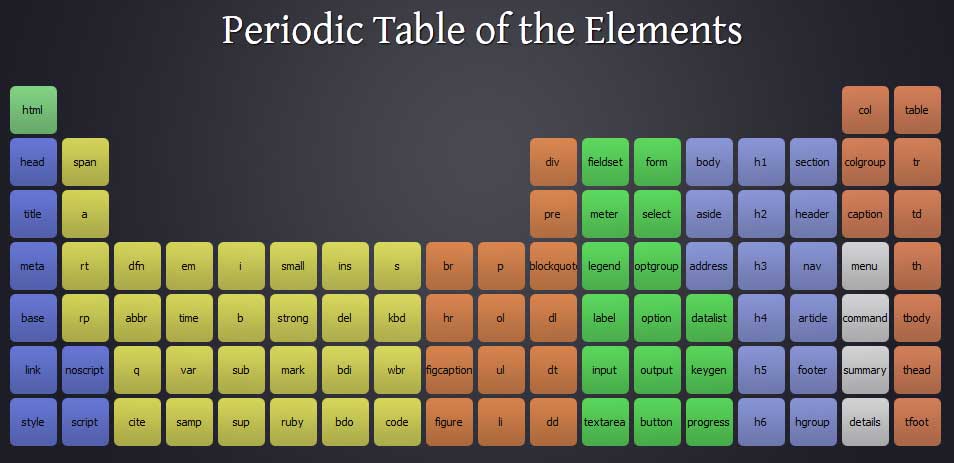 Periodeic table of HTML5 Elements, arrange by type.