Free CSS, PHP, flash and AJAX charts
As much as I hate filling a form I love seing a chart. I don’t know why. It can show a lot of things. We use charts to see our progress, to see our income, loses, gains, this versus that, he versus me, us and them etc. It’s like when we were little kids and asked our dad who’s stronger…the lion or the tiger. We feel like there’s the answer…in that chart right in front of us. Facts besides words, numbers over presumptions…visual results. If you know how to play with parameters, it’s your map of the future. There’s the road…look at last year how wrong you did :). It’s funny I know…imagination is the limit. We searched and researched and found some nice examples with various charts. In PHP, CSS, AJAX or Flash here’s our list. Have fun!

“Having a working knowledge of XHTML and CSS when developing applications is a big help in knowing what can be done client-side and what should be generated server-side.” – Vertical, horizontal, simple or complex CSS bar graphs.

“A simple chart..Using YUI and YUI-Ext libraries plus a CSS design taken from Eric A. Meyer”

If it’s a bloggers pleasure to see others writing about them or their work than Stu Nicholls must know how heaven fels like. “These charts are nothing more than a styled definition list with just classes defining each line.”

Using just a small image and the power of CSS standards-schmandards managed to show us in a nice chart the “value of banana imports in millions of US dollars per million people” in ’98 🙂

“XML/SWF Charts is a simple, yet powerful tool to create attractive web charts and graphs from dynamic XML data…makes the best of both the XML and SWF worlds. XML provides flexible data generation, and Flash provides the best graphic quality.”

Very universal and fully configurable flash charts from amcharts. Free to download if you keep the link back.

“Originally designed as the foundation for the Greenplum Monitor?a browser-based database monitoring application to be released later this year?the Charting engine is a cross-browser way of creating very complex charts easily, that can be updated on a regular basis.”

“PlotKit is a Chart and Graph Plotting Library for Javascript. It has support for HTML Canvas and also SVG via Adobe SVG Viewer and native browser support…PlotKit is a complete rewrite of CanvasGraph. It is better structured and supported.”

Some more great looking examples of PlotKit in action.

“…it allows various forms of charts to be created, without any additional plugin, and without using images.”

“CSS has the ability to draw rectangles with borders and fills. With a little bit of lateral thinking, it doesn’t take too much effort to draw simple business charts. Okay, it’s not as instant as Excel, but much lower in bandwidth requirements than any image file.”

An XHTML/CSS graph that runs in most modern browsers with an easy database integration.
 A Light weight, small framework for beautiful forms: Ideal Forms
 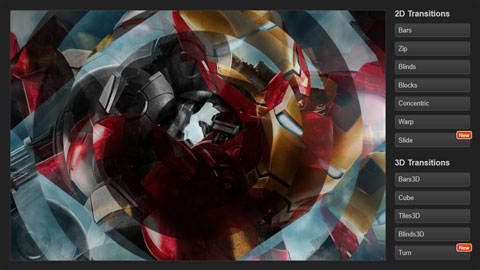 CSS3 Powered jQuery Image Slider for 2D or 3D transitions – Flux Slider
  How to Start a Functioning Website Under Thirty Dollars 2021?
  The HTML5 Time Element Is Back and Better Than Ever
  Mozilla Introduce Firefox 9, with Speed and less memory improvements
 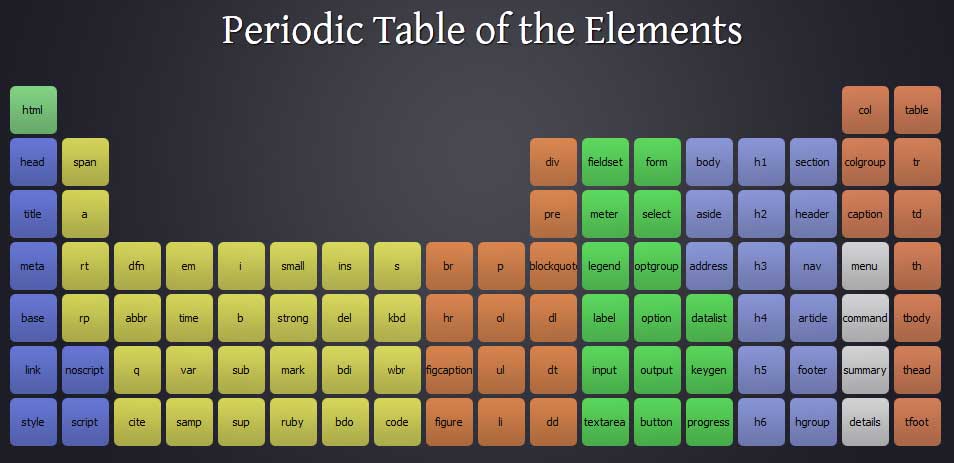 Periodeic table of HTML5 Elements, arrange by type.